
· 8 min read · worthmydegree.com
Should you ride student loan forgiveness out?
Someone owes $175,000, opens their servicer's estimate for an income-driven plan, and sees a monthly payment they can live with and a total over twenty years of about $50,000, after which the rest is forgiven. Paying $50,000 on $175,000 looks like the easiest decision in personal finance. We have two catches: the payment rises with your income, and that the forgiven balance is taxed.
Figures computed by this site's own repayment simulator are rounded to the nearest thousand dollars. The regulatory dates, the 120-payment count for public service forgiveness, and the section numbers are exact.
What riding actually costs
Take that borrower: $175,000 at 7 percent, single, a household of one, starting at $80,000 a year with 3 percent raises. Riding the income-driven minimum for twenty years on IBR, then having the remainder discharged, comes to about $167,000 in payments, about $253,000 discharged, and roughly $80,000 of federal tax in the discharge year, because since January 1, 2026 a discharged balance is ordinary income. About $247,000 all in. Paying the loan off on the ten-year Standard plan costs about $244,000.
| Path | Payments | Discharged | Tax on it | All in |
|---|---|---|---|---|
| Standard, 10 years | ~$244,000 | none | none | ~$244,000 |
| IBR, ride 20 years | ~$167,000 | ~$253,000 | ~$80,000 | ~$247,000 |
| RAP, ride 30 years | ~$369,000 | ~$80,000 | ~$25,000 | ~$394,000 |
| IBR under PSLF, 120 payments | ~$68,000 | ~$253,000 | none | ~$68,000 |
The last row is the exception that makes the instinct correct. Under Public Service Loan Forgiveness the discharge arrives after 120 qualifying payments and is not taxed, so the same borrower pays about $68,000 and owes nothing afterward. If a government or nonprofit employer is in the picture, that is the row to look at, and the rest of this guide is about the other three.
The worst place to be is the middle
The cost of riding does not rise with income and keep rising. It climbs, peaks, and falls back. Earn little and most of the balance is discharged, so the ride wins. Earn a lot and the payment grows until it clears the loan inside the term, so nothing is discharged, no tax is due, and the cost falls back toward the Standard plan. In between, the borrower makes twenty years of large payments and still does not clear the balance, and gets both the payments and the tax bill.
For that $175,000 borrower on IBR, riding is cheaper than paying off only below about $78,000 of starting income. It is worst at about $150,000, where it costs about $107,000 more than the Standard plan. Across balances the peak sits at roughly four fifths of what you owe, so the worst income for a $100,000 loan is a different number from the worst income for a $250,000 one, and neither is the middle of anything except its own chart. The infographic version draws the whole map, balance along the bottom and adjusted gross income up the side.
That last phrase matters. Both plans run on adjusted gross income, which is what is left after retirement contributions and similar deductions, and not on salary. Plotting a salary lands a reader to the right of where they belong.
The 2026 plan change moved the answer, not just the payment
Which plan you are on decides the shape of the trap, and for most people it is no longer a choice. Under 34 CFR 685.209(d)(5), only Direct Loans made before July 1, 2026 can be repaid under IBR, PAYE or ICR. Every loan made since is on the Repayment Assistance Plan, RAP, or the new Tiered Standard plan.
Under IBR there is one line. Below it riding wins; above it riding loses, mildly and forever, because 34 CFR 685.209(f)(2) caps an IBR payment at what the ten-year Standard plan would charge. The payment can rise until it equals the Standard payment and no further, so the ride converges on the Standard plan's cost and never beats it.
RAP has no such cap. A high earner on RAP overpays, clears the loan early, and comes out cheaper than the Standard plan outright, so RAP's losing region is a band rather than everything above a line. That sounds better and is not, because the band is worse where it bites and it opens lower. On the same $175,000, RAP's worst case is about $90,000 of starting income at roughly $187,000 more than paying off, against IBR's worst of $107,000 at about $150,000. RAP's ride stops winning at about $55,000 of income where IBR's holds to about $78,000, and RAP only becomes cheaper than the Standard plan again above about $225,000. Neither plan is simply better than the other, which is why the infographic has two panels.
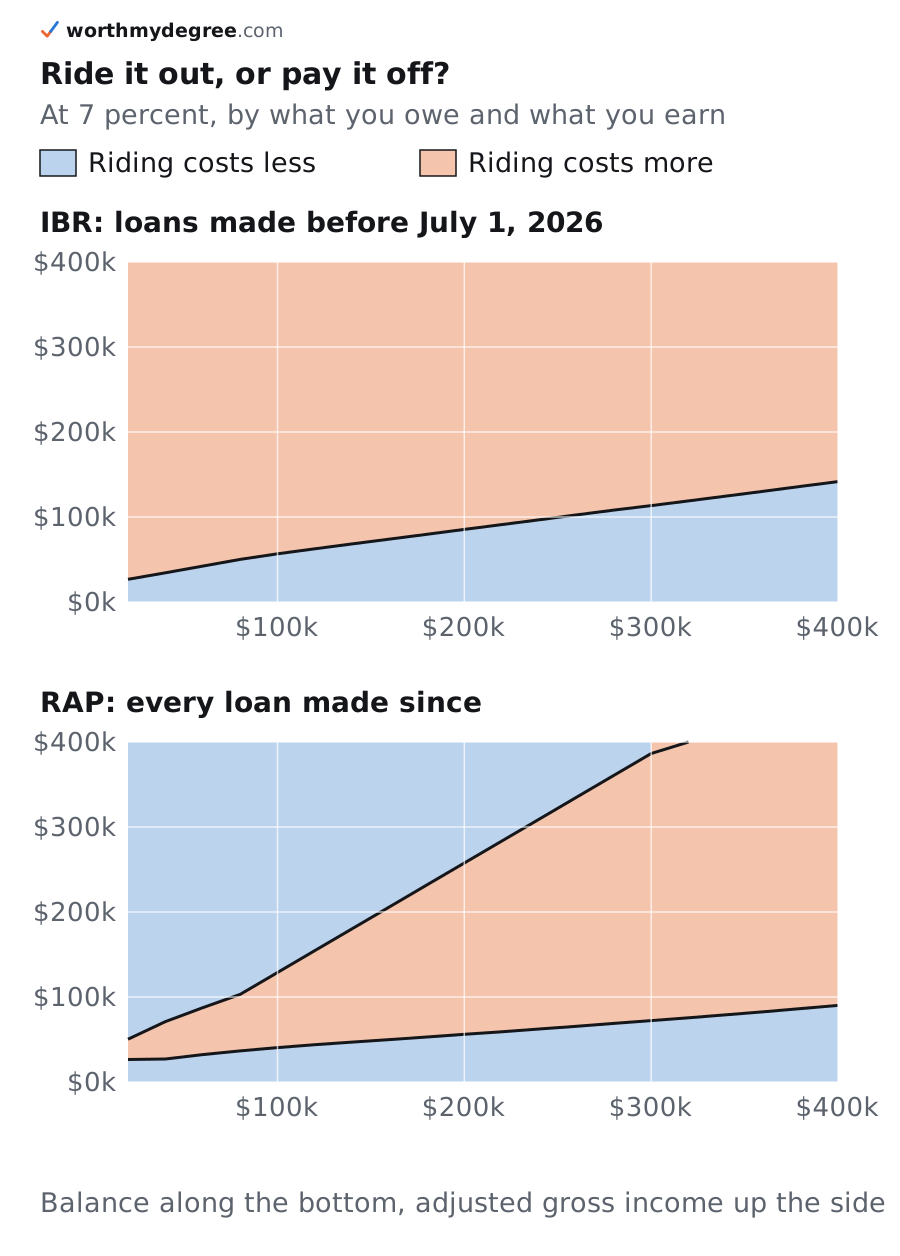
Blue is where riding costs less than paying the loan off in ten years, orange is where it costs more, at 7 percent for a single filer in a household of one with income rising 3 percent a year, federal tax only, in nominal dollars. The one line on the IBR panel is the cap at work. The two lines on the RAP panel are its absence: the band between them is where riding loses, and it is both worse and lower than IBR's.
Paying extra on a loan headed for forgiveness
The intuitive move is to pay more than the minimum, but if you're on track for loan forgiveness, that’s about the most expensive mistake you can make. Every extra dollar you throw at a balance destined to be wiped clean buys you nothing. It just shrinks the amount the government forgives.
Look at those extra payments as an investment return, especially if you're juggling something like $40,000 in private debt at 9%. Prepaying that 7% federal loan only makes mathematical sense if your earnings are high:
- At $140,000 of income: You won't receive forgiveness anyway, so paying early locks in a standard 7% return (though paying down that 9% private debt would still beat it).
- At $80,000 of income: The return drops to roughly 3.6% a year, worse than what you’d earn simply parking the cash in Treasuries.
- At $60,000 of income: The return plummets to around negative 12% a year. Paying early here actively destroys your money, because you’re footing the bill for a balance that was going to disappear on its own.
Under 34 CFR 685.211(a)(3), a prepayment of at least one monthly amount advances the next due date unless the borrower asks otherwise, so an unlabeled extra payment buys a payment holiday rather than a smaller balance. Anyone paying extra has to name the loan and ask, in writing, for the money to go to principal.
What the calculator shows, and what it did not
A plan comparison table, on this site and everywhere else, lists what each plan takes in payments. It does not list the tax on the discharge, because the tax is not a payment, and for a borrower with only federal loans and nothing spare that omission was the whole story. On a $250,000 balance at $110,000 of income, the IBR row's total understated the true cost by about $120,000, nearly half of what the table showed, beside a note saying the balance is forgiven.
The repayment tool now prices both. Under its table, a panel states the all-in cost of the plan you are looking at, tax included, against the cheapest plan of the other kind, and says which is cheaper by how much.
What this cannot tell you
Everything above is in nominal dollars. The income-driven payments arrive later and smaller, so in today's money the ride looks better than these totals make it look; anyone who objects that a dollar in year twenty is not a dollar today is right. The tax is federal only, single filer, standard deduction, at the projected income in the discharge year, so a state with an income tax makes the discharge cost more, never less. very figure assumes a 7 percent rate. A different rate moves every line on the map.
This is not advice. It works out what each path costs at your balance and your income, on whichever plan your loans qualify for, and it tells you how much a change in income would change that answer. What you do with it is up to you. If you are thinking about switching plans, the switching guide (/guides/switching-repayment-plans-2026) covers that separately.